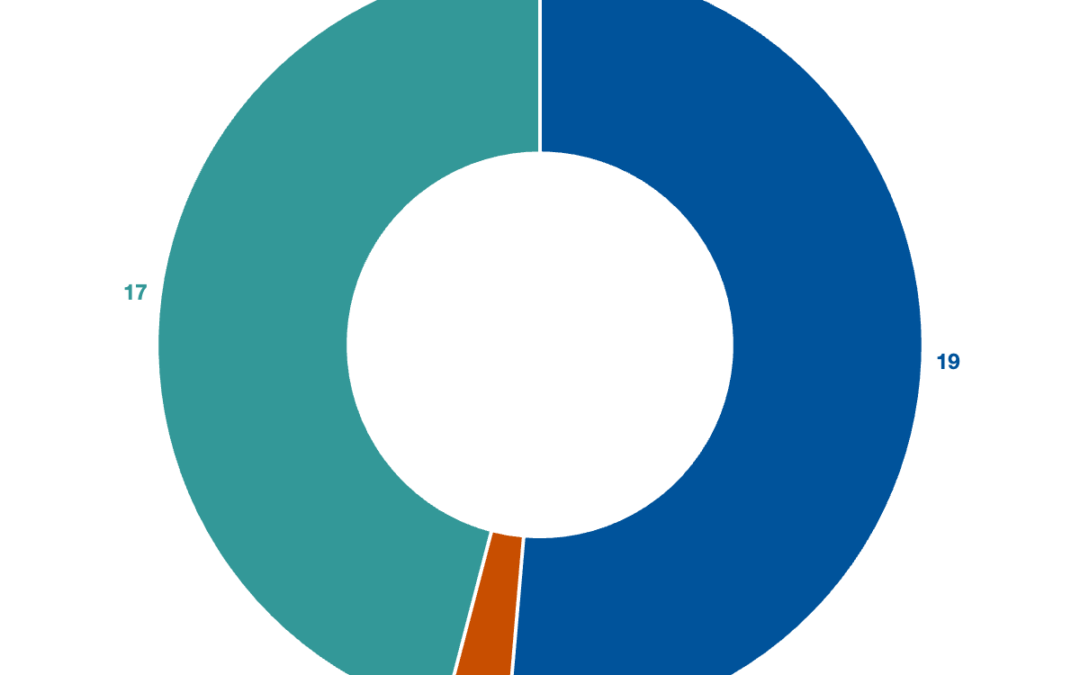
by Bart Hubbard | Nov 17, 2023 | 2024 | 0 comments Doughnut chart. Data table with 3 rows and 2 columns follows. 3+ Years 19 1-2 Years 1 None 17