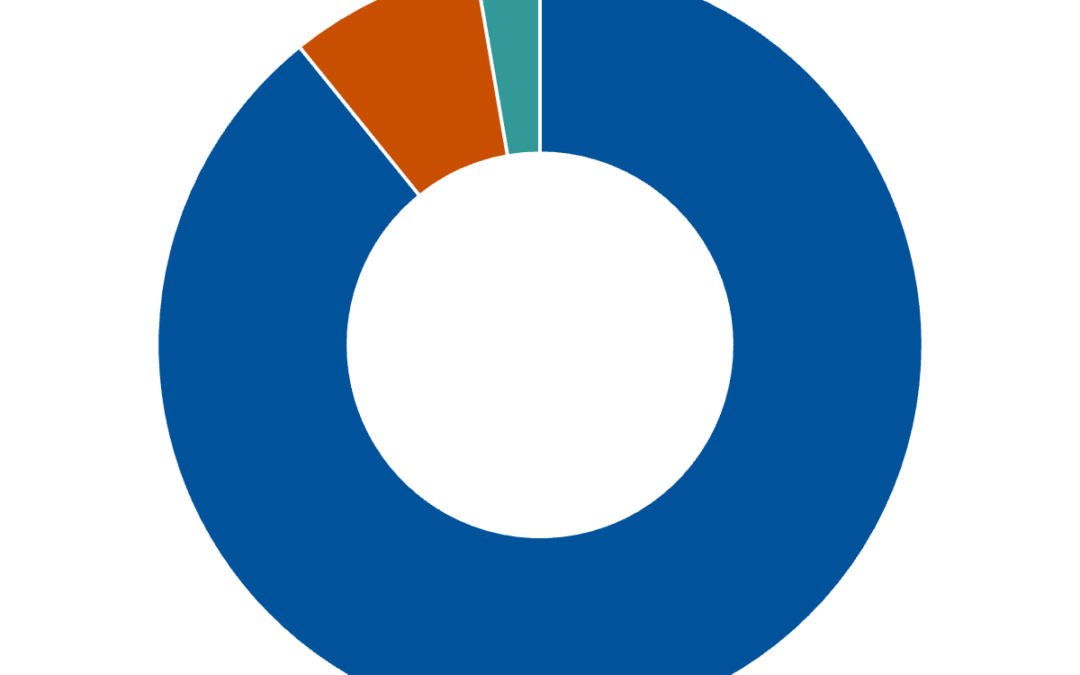
by Bart Hubbard | Nov 17, 2023 | 2024 | 0 comments Doughnut chart. Data table with 3 rows and 2 columns follows. Bachelors 33 Masters 3 MD/PhD 1